

Trader use charts to determine market direction and identify possible buying and selling opportunities. There are three types of charts commonly used in trading,
- Line chart;
- Bar chart;
- Candlestick chart.
Line Chart:
These charts are handy for quickly determining the trend – only the current/close price is graphed – as such these charts should not be used for placing stop loss or take profit orders.
Bar Chart:
The chart is created with the use of bars where each bar has a high (top) and a low (bottom) with a line on either side; right side being the opening price and the left side being the closing price for the selected time period.
Candlestick Chart:
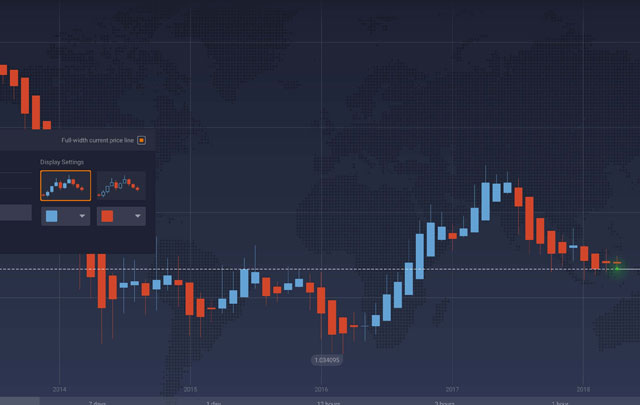
This chart is created much like bar charts, with the only difference being that candlesticks add dimension and colour to the Bar Chart by depicting the area of the bar between the open and close as a two dimensional real body.
More News Posts
China manufacturing PMI shrinks more than expected in April as US trade war bites
Chinese manufacturing activity shrank more than expected in April as…

US stock futures muted ahead of econ data barrage, megacap earnings
U.S. stock futures were largely muted Monday evening after subdued…
Australia’s Alkane to acquire Canada’s Mandalay to form a $650 mln gold producer
Australia’s Alkane Resources Ltd (ASX:ALK) will acquire Canada’s Mandalay Resources…
Trump said ’doing fine’ with China, has no plans to fire Powell
U.S. President Donald Trump delivered remarks on the state of…
US stock futures rise after Trump remarks rattle Wall St; tech earnings due
U.S. stock index futures rose in early Asian trade on…

China CPI, PPI inflation fall more than expected in March as US trade war heats up
Chinese consumer inflation shrank more than expected in March, reflecting…

Australia consumer sentiment hits 6-mth low in April on US tariff worries- Westpac
Australian consumer sentiment fell to a six-month low in early…
Black Monday or Face Ripping Rally?
Following last week’s unprecedented two-day bloodbath in stocks post-tariffs, investors…
Oil prices extend steep declines as OPEC+ output hike, Trump tariffs weigh
Oil prices extended losses in Asian trading on Friday after…
Trump unveils sweeping tariffs on all imports and higher levies on “bad actors”
President Donald Trump said Wednesday the United States will impose…
