

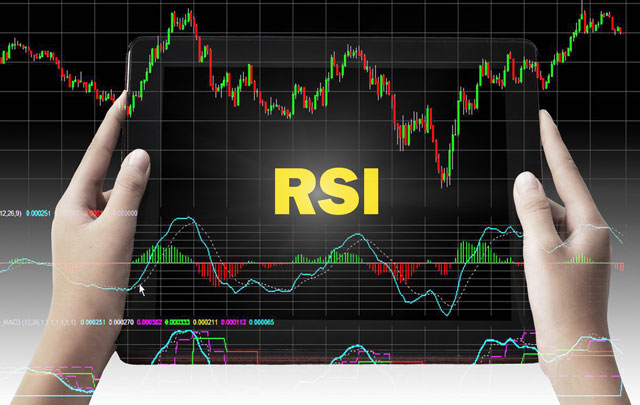
In the last section we looked at Moving Average crosses and using Moving Averages to determine the trend. In this section we will move on to a new type of indicator – the Oscillator. Unlike the MA, Oscillators tend to appear below your chart in a separate window. We’re going to take a look at one of the most common oscillators, the Relative Strength Index or RSI:
RSI looks at an instrument’s ability to close higher/lower over a given period. When RSI is above 70, is considered ‘overbought’ and when it’s below 30, it’s considered ‘oversold’. It’s important to note that just because a security is overbought/oversold, does not mean it’s going to reverse – Indicators can read overbought/oversold for extended periods of time. A sell signal does not occur until RSI crosses back from overbought/oversold into the 70-30 range:
More News Posts
China manufacturing PMI shrinks more than expected in April as US trade war bites
Chinese manufacturing activity shrank more than expected in April as…
US stock futures muted ahead of econ data barrage, megacap earnings
U.S. stock futures were largely muted Monday evening after subdued…
Australia’s Alkane to acquire Canada’s Mandalay to form a $650 mln gold producer
Australia’s Alkane Resources Ltd (ASX:ALK) will acquire Canada’s Mandalay Resources…
Trump said ’doing fine’ with China, has no plans to fire Powell
U.S. President Donald Trump delivered remarks on the state of…
US stock futures rise after Trump remarks rattle Wall St; tech earnings due
U.S. stock index futures rose in early Asian trade on…

China CPI, PPI inflation fall more than expected in March as US trade war heats up
Chinese consumer inflation shrank more than expected in March, reflecting…

Australia consumer sentiment hits 6-mth low in April on US tariff worries- Westpac
Australian consumer sentiment fell to a six-month low in early…
Black Monday or Face Ripping Rally?
Following last week’s unprecedented two-day bloodbath in stocks post-tariffs, investors…
Oil prices extend steep declines as OPEC+ output hike, Trump tariffs weigh
Oil prices extended losses in Asian trading on Friday after…
Trump unveils sweeping tariffs on all imports and higher levies on “bad actors”
President Donald Trump said Wednesday the United States will impose…
